A populated test is a sheet of sampled records with an empty column for each question in the program’s test scripts. What remains is to fill those columns and turn the answers into a result you can hand to a second line reviewer or an examiner. Both happen on the test itself: the Testing tab holds the working paper, and the Analysis tab holds the report generated from it.

Before you start

  • The test needs a sample in its sheet. Drawing one is Populate a compliance test.
  • Compliance must be enabled for your organization (Settings > Features). Without it the Compliance section, and the test, are not reachable.
  • Know the population figure you intend to stand behind for the period. Rulebase records it, but it does not work it out for you.

Fill the sheet

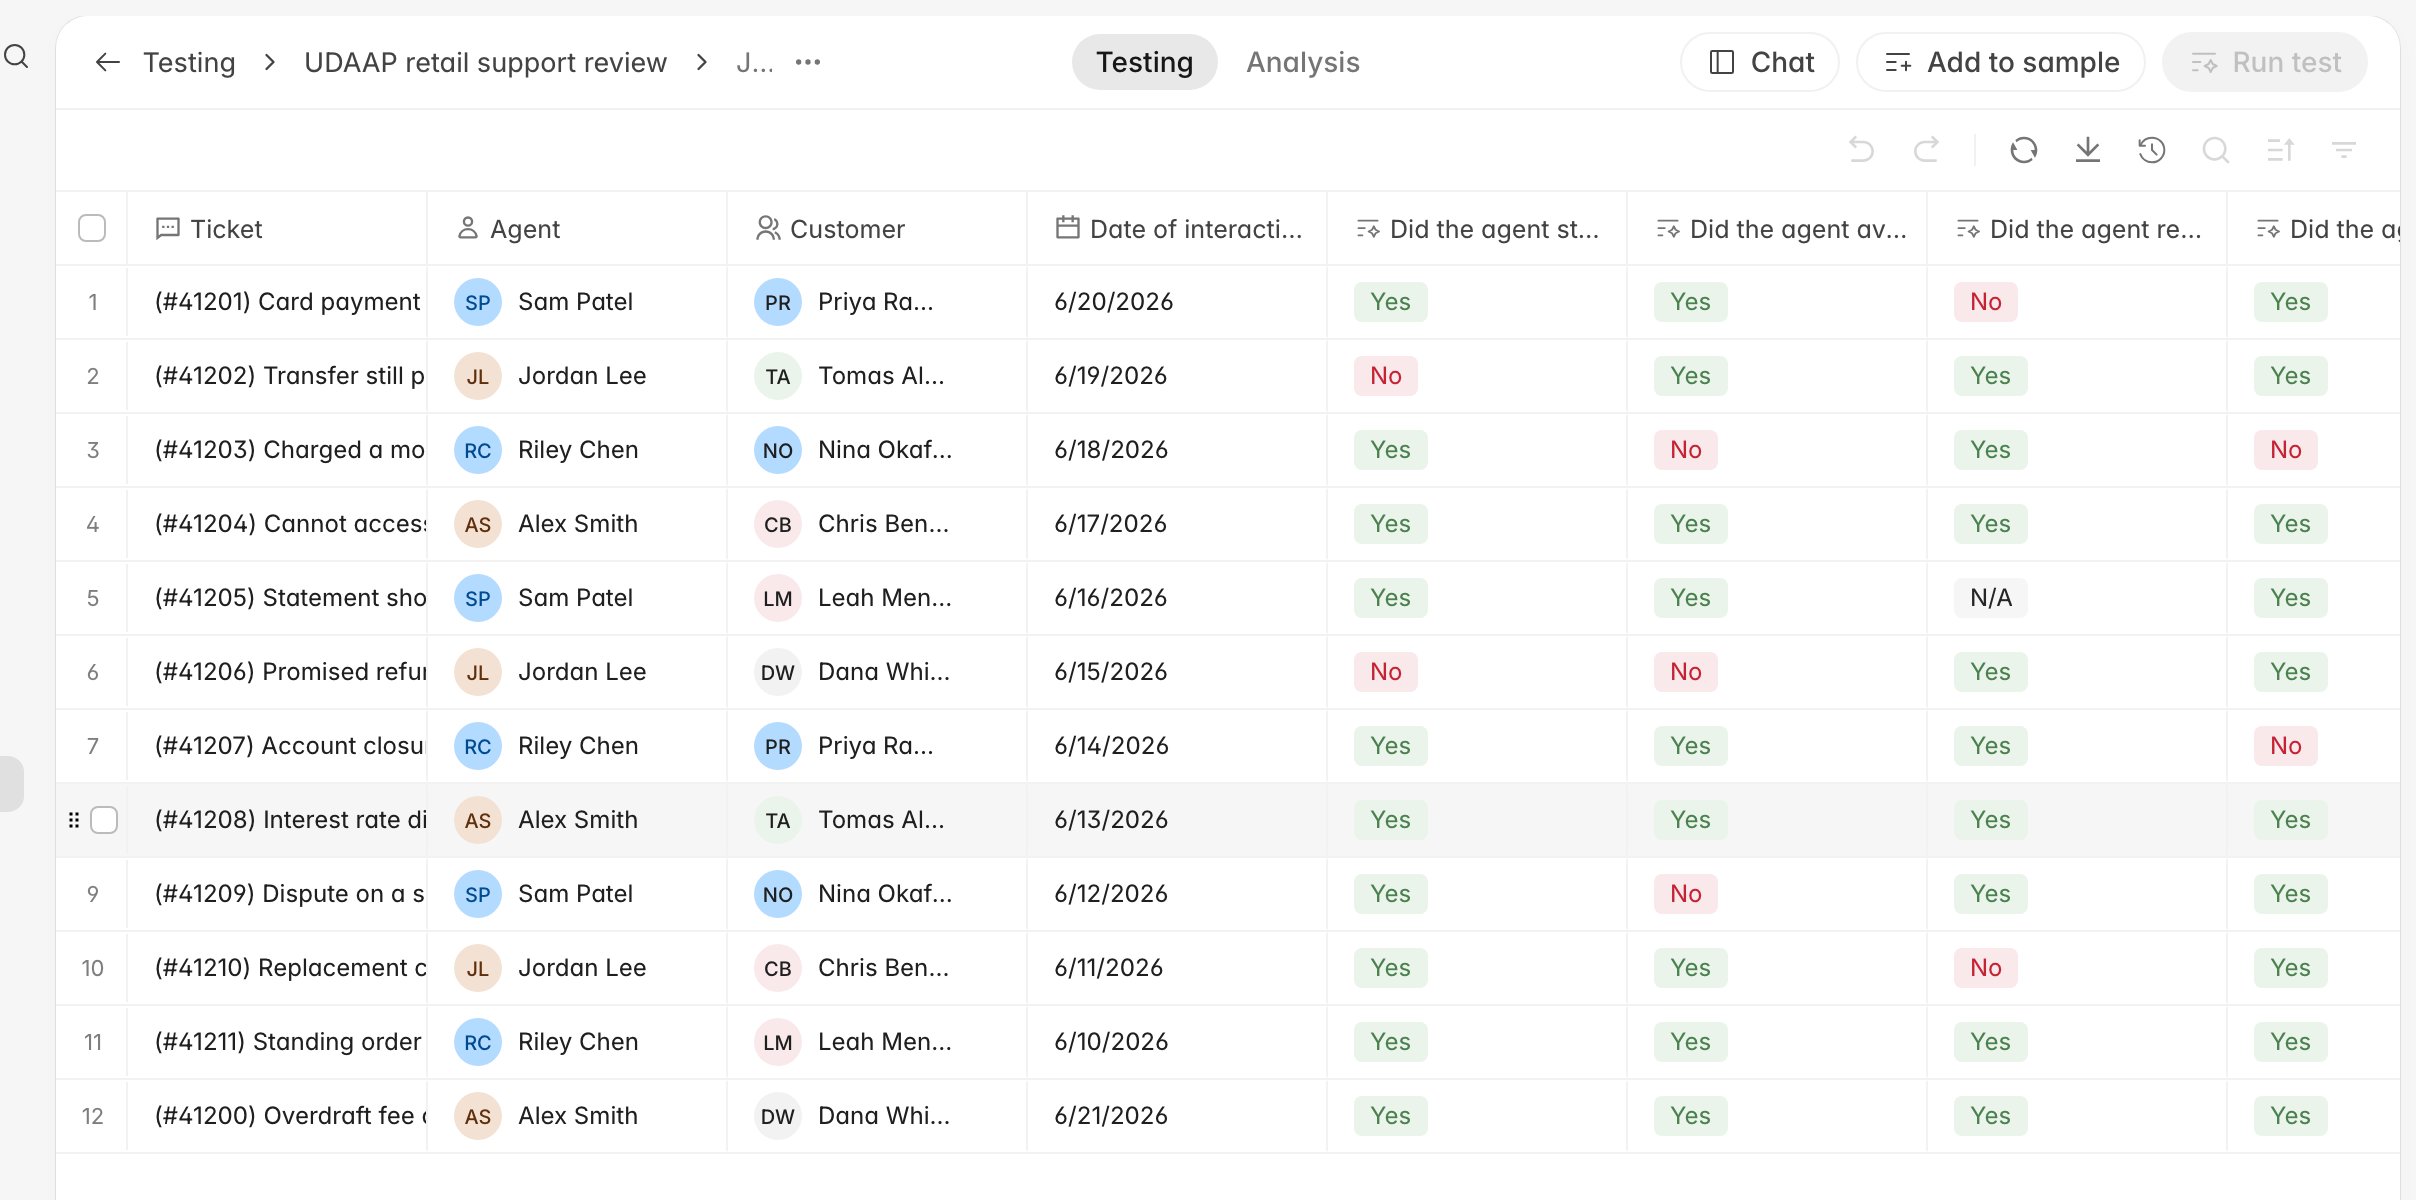
Run test sits at the top right of the Testing tab and fills the empty generated cells for the rows in the sheet. It appears once the sheet has rows, and it is disabled when there is nothing left to fill: either because every generated cell has an answer, or because the range you have selected is already complete. Select a range first when you want to re-run part of the sheet rather than all of it. Test header with Chat, Add to sample, and an enabled Run test button The cell states, the reasoning behind each answer, and what to do about a Failed cell are covered in Populate a compliance test. Work through those before generating a report: the analysis reads whatever is in the sheet at the moment you generate it, and a gap in the sheet becomes an unexplained gap in the report. A finished sheet carries one row per sampled record and an answer in every question column, and Run test greys out because there is nothing left to fill. Filled compliance test sheet with ticket, agent, customer, and date columns beside Yes and No answers for each test question

Record the counts that describe your coverage

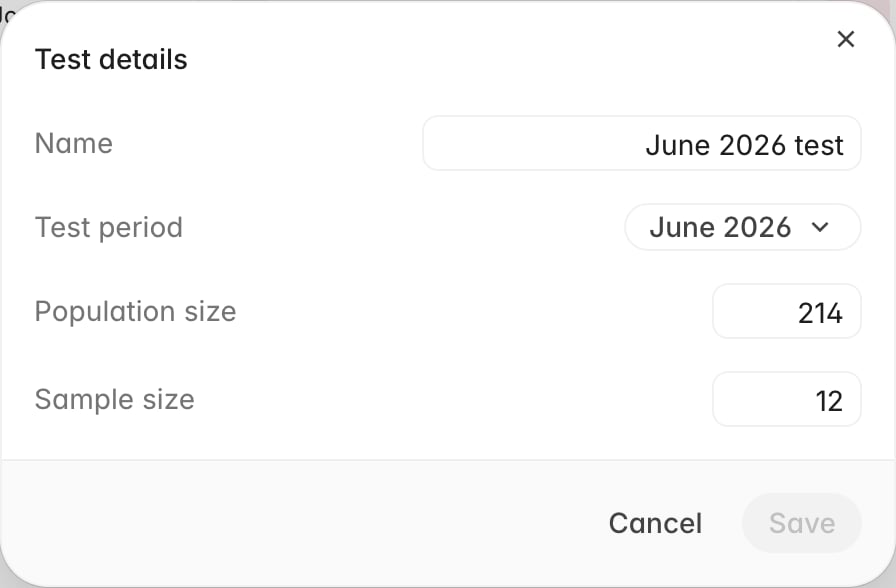
Open the menu beside the test name, then View details to see the Name, Test period, Population size, and Sample size. Test details dialog with name, test period, population size, and sample size fields Population size and Sample size are yours to maintain. Rulebase does not derive them from the sheet, and it will not let the sample exceed the population. They are passed to the AI as context while cells are filled, and they are the numbers a reviewer will read as your coverage claim for the period, so fill them in from your own population query rather than leaving them at whatever the last cycle held. Sample size has one practical side effect: it becomes the default sample size in the Populate test dialog, which defaults to 20 when the field is empty. Setting it before you draw the sample is the tidier order.
Generate the analysis

  1. Open the Analysis tab. On a test with no report yet, it reads No analysis generated.
  2. Click Generate analysis.
  3. Leave the tab open. Rulebase shows the steps it is taking while it reads the sheet, and the report appears in place when it finishes.
Generation reads the sheet’s rows and the distribution of answers in each column, the program’s controls and test scripts, the frameworks attached to the program, and the test period. It does not re-examine the underlying tickets, cases, or alerts; the answers in the sheet are its evidence, so the sheet has to be finished first.

What the report contains

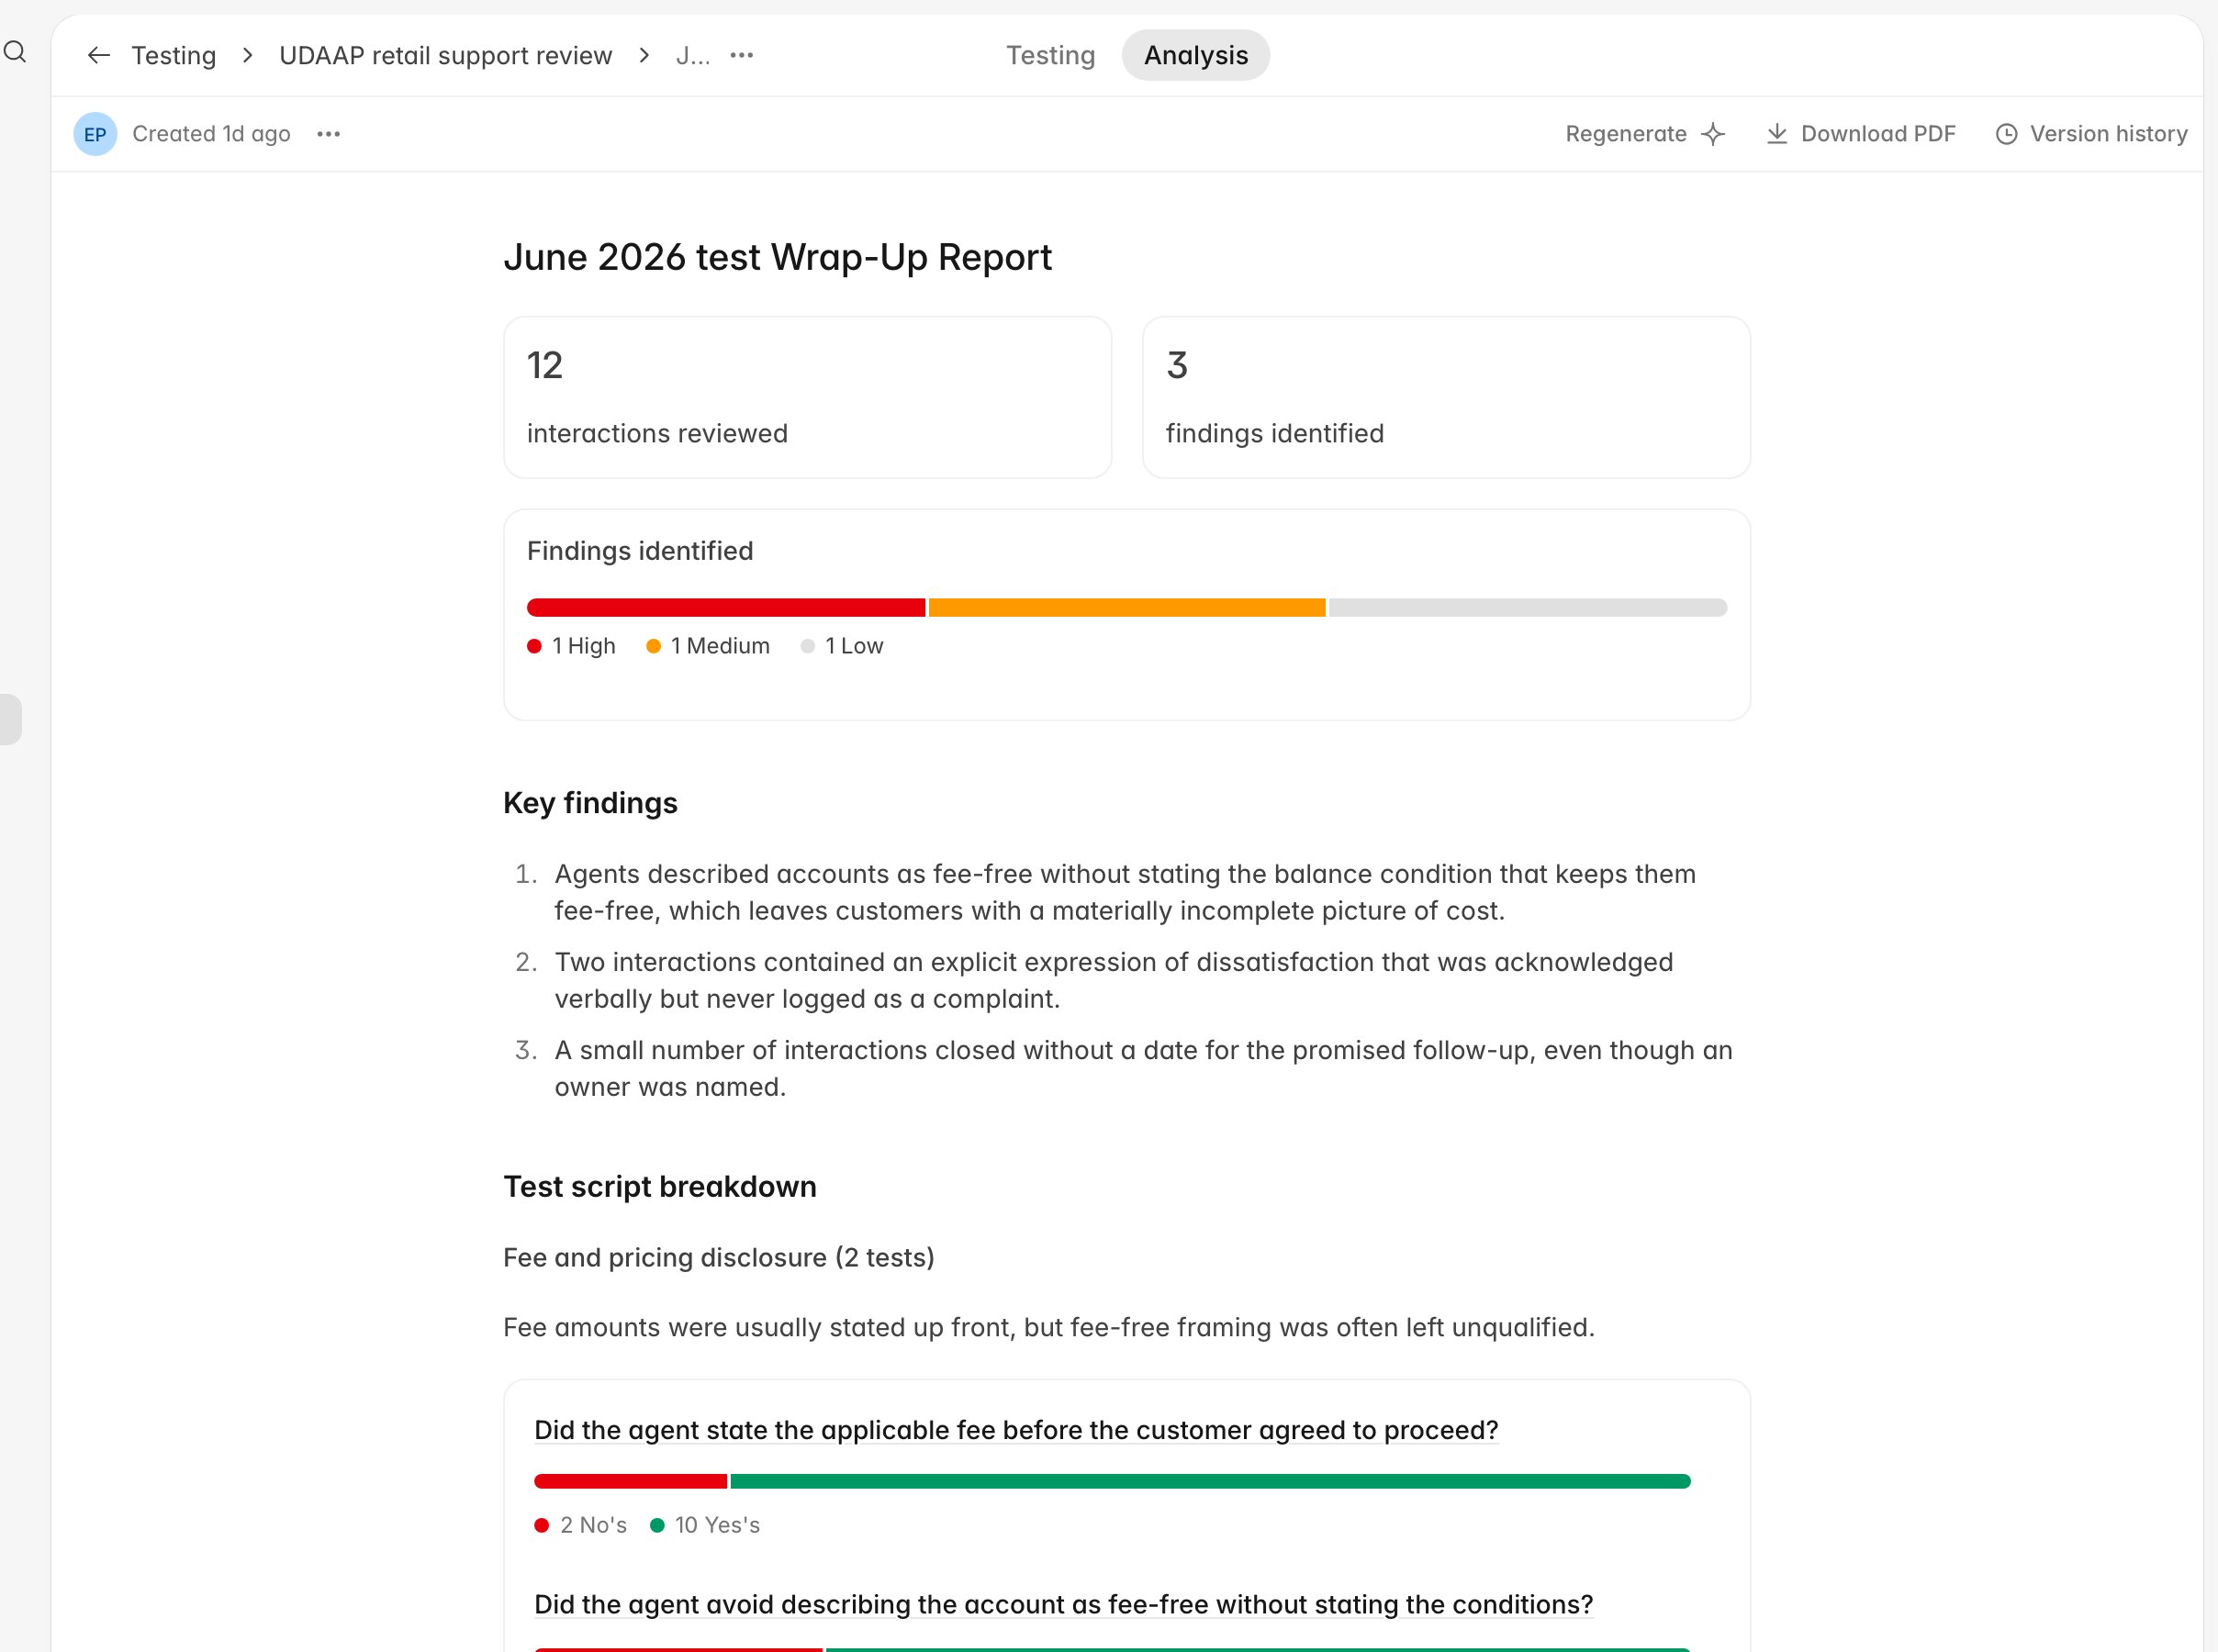
Analysis report with interactions reviewed, findings identified, a severity bar, key findings, and the start of the test script breakdown
  • The counters — how many records were reviewed, labelled for the program’s record type, and how many findings the report raised.
  • Findings identified — the severity split across High, Medium, and Low.
  • Key findings — the findings in severity order, written as statements about what was observed.
  • Test script breakdown — one block per control, with a one-line summary and, for each question, the split of Yes’s, No’s, and N/A.
  • Recommendations — a short list of remedial actions tied to the findings.
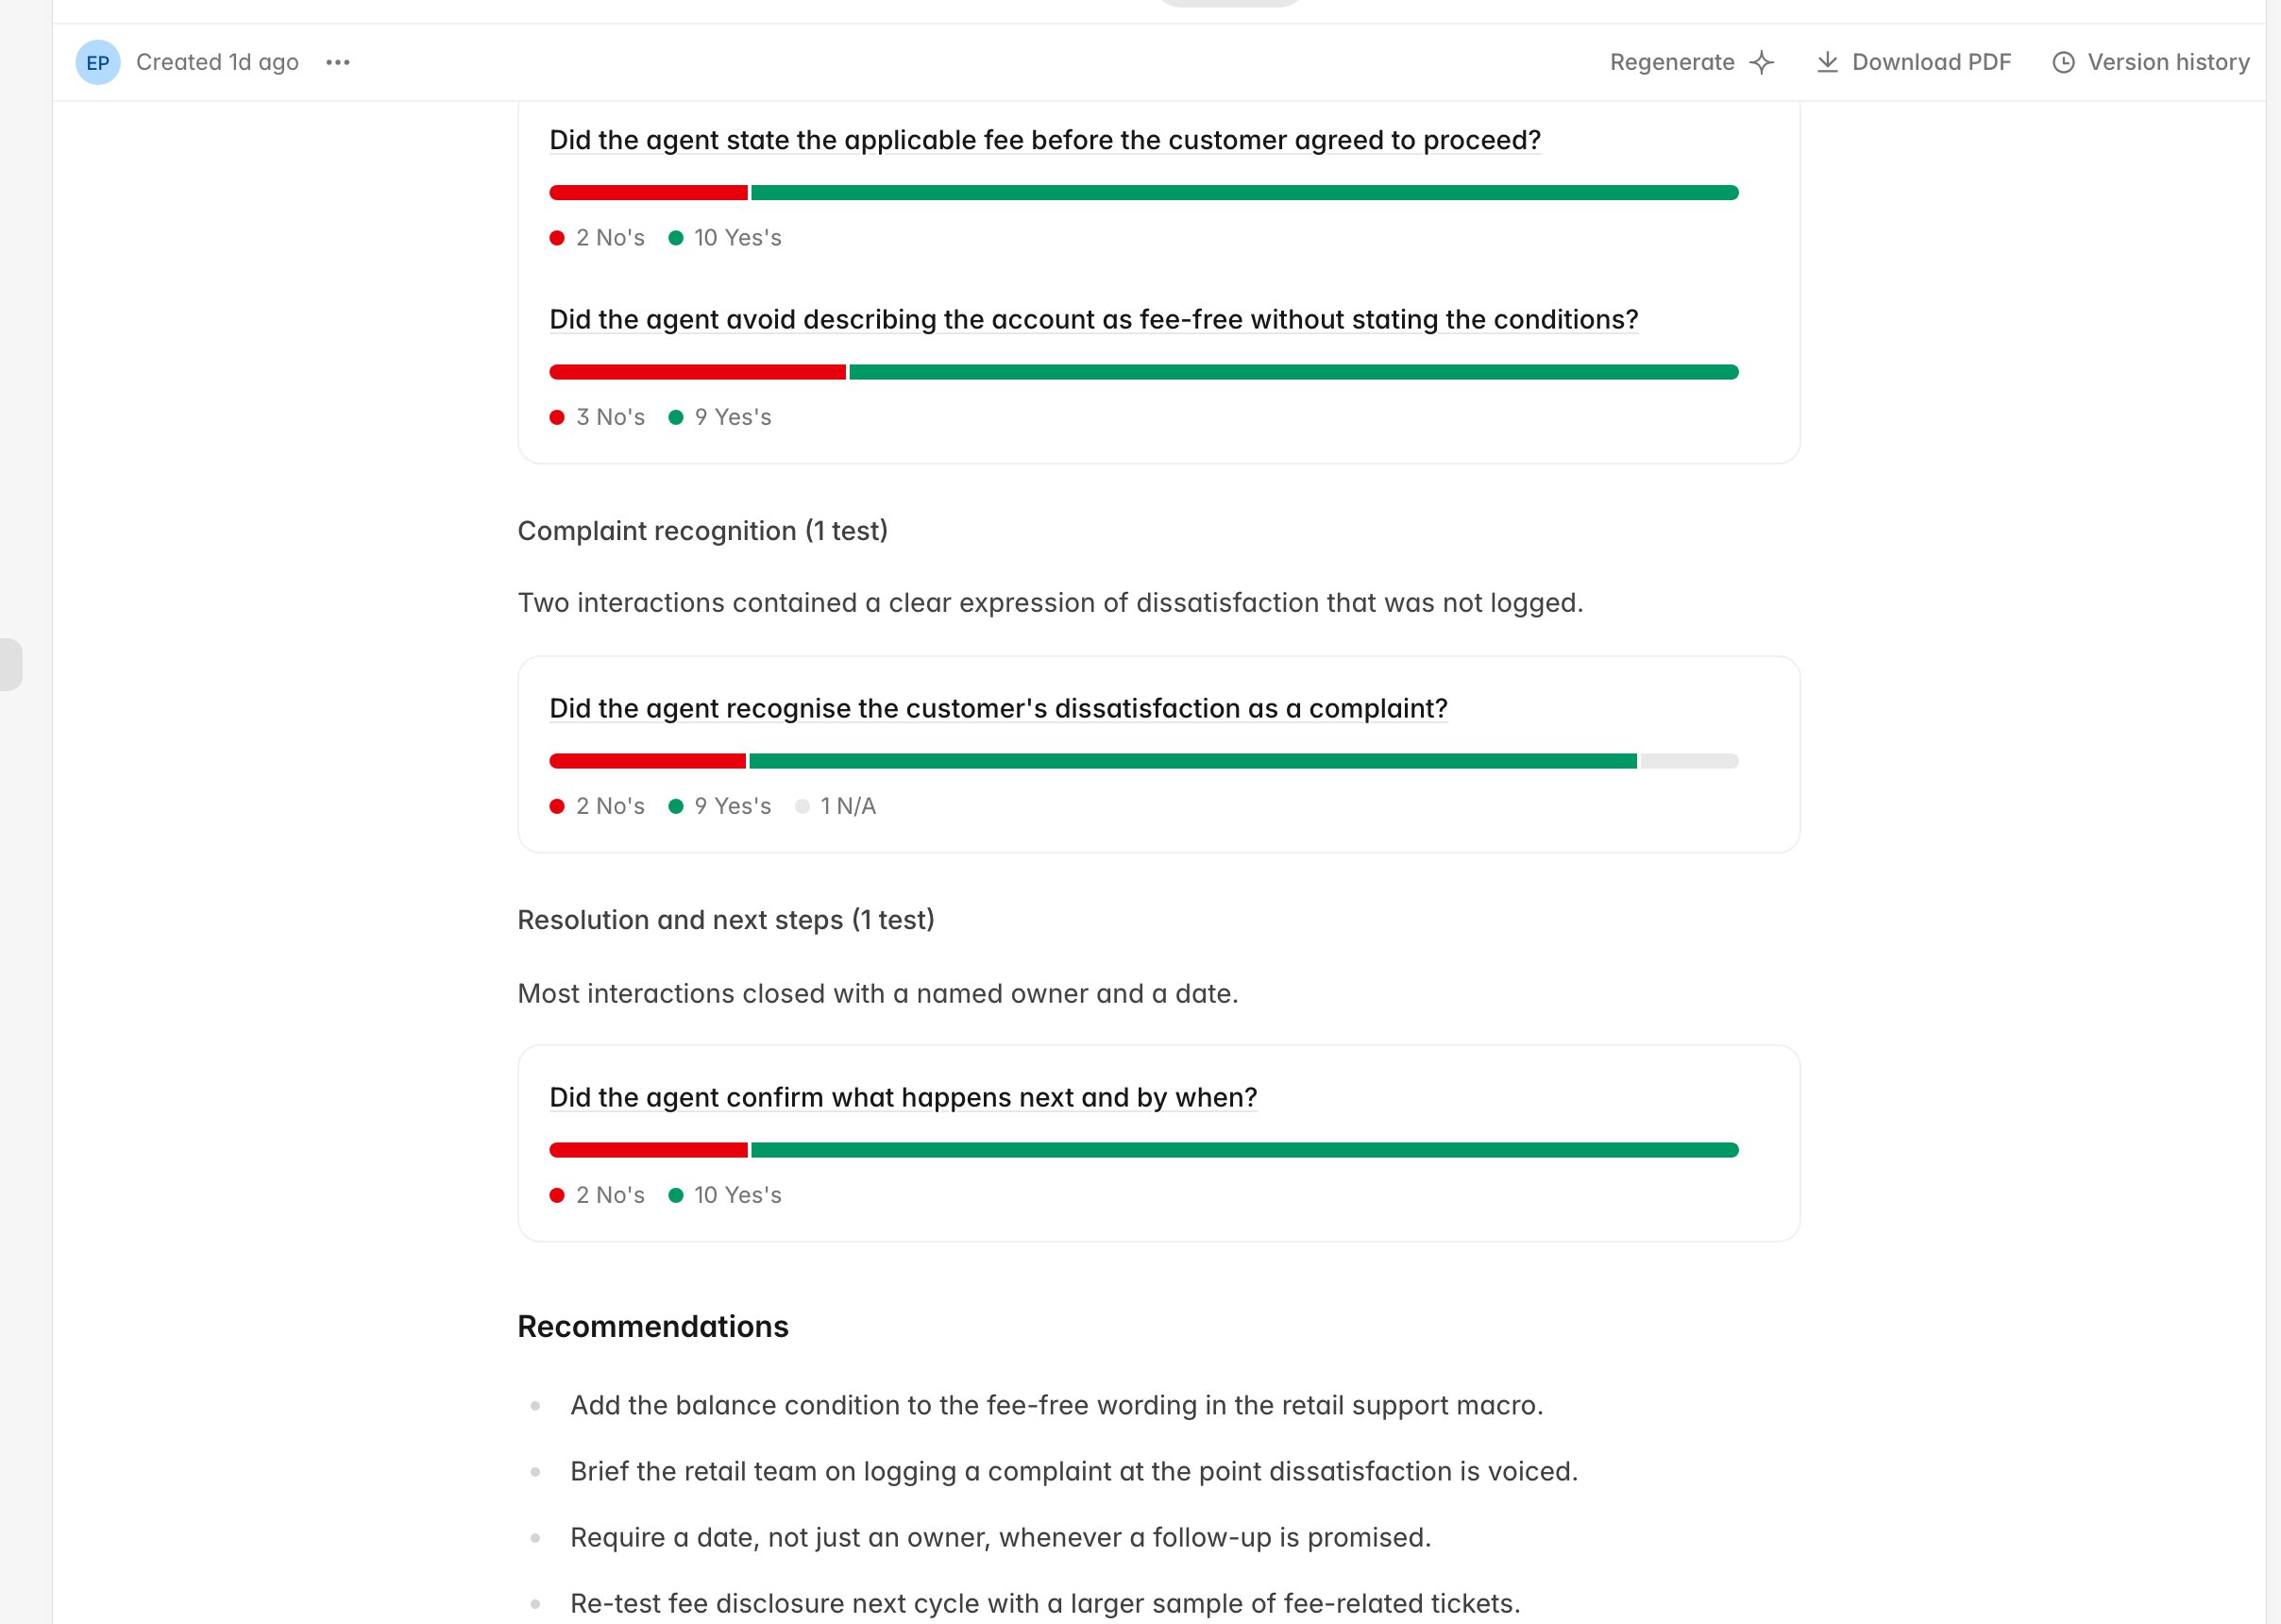
Test script breakdown grouped by control with per-question answer splits, followed by the recommendations list The counts come from the cells; the prose is model-written. Read the findings and recommendations as a well-informed draft of your write-up rather than as the write-up itself, and edit your own summary from them.
A report covers one test period. Rulebase does not compare periods for you, so quarter-on-quarter trending is something you assemble from the reports or from the sheet exports.

Work the exceptions

Every No and every N/A in the breakdown is a question to answer, not yet a finding.
  1. In Test script breakdown, click the question you want to examine.
  2. The Question breakdown panel opens with the answer split, the total row count, and the rows grouped by answer. Show 5 more expands a group beyond its first five rows.
  3. Note the records in the No and N/A groups, then open those rows back in the sheet to read the cell’s reasoning and follow its citations to the source record.
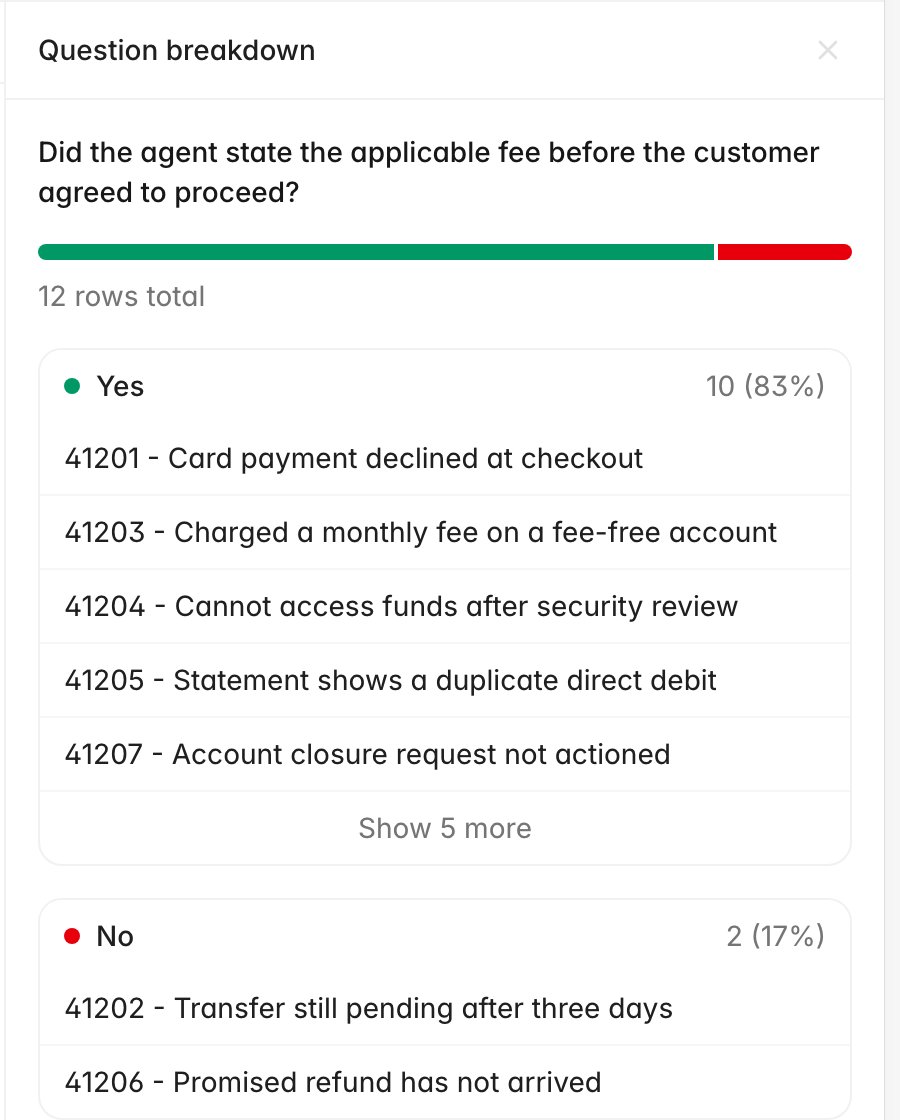
Question breakdown panel listing the tickets behind the Yes and No answers for one test question An N/A usually means the control could not apply to that record: no fee was discussed, so nothing could be disclosed. That is a legitimate answer, but it also reduces your tested count for that question, so record it as such rather than folding it into the passes.

Before you sign the cycle off

  • Every generated cell has an answer. Nothing is still Failed.
  • Each No and N/A has been checked against the source record, not just the cell.
  • Population size and Sample size match the methodology you documented on the program.
  • The report was generated after the last change to the sheet. If you corrected a cell afterwards, regenerate.
  • The findings you are reporting are ones you can evidence from specific records.

Keep the working papers

Download PDF exports the report as it appears. Regenerate produces a new version (useful after you have fixed cells), and earlier completed reports stay available under Version history, so a superseded conclusion is still retrievable. Delete report in the menu next to the report’s author removes a version outright. For the sheet itself, use the download icon in the toolbar above the grid, Export sheet (CSV). That file is the row-level record behind the report’s counts.