

Before you start
- Who appears here comes from the agent roster, not from who has a login. An agent missing from a team is usually missing from the roster or unassigned: Manage the QA agent roster is the fix.
- Manager, team lead, quality analyst, compliance analyst, member, and admin roles all carry View the agent roster, which is what these pages need. Agents are the exception: they see their own evaluations and performance rather than the team list.
- A membership scoped to one team sees only that team here.
- Scores only appear for periods that were actually evaluated. A week with no evaluations reads as No QA evaluations in this period rather than zero.
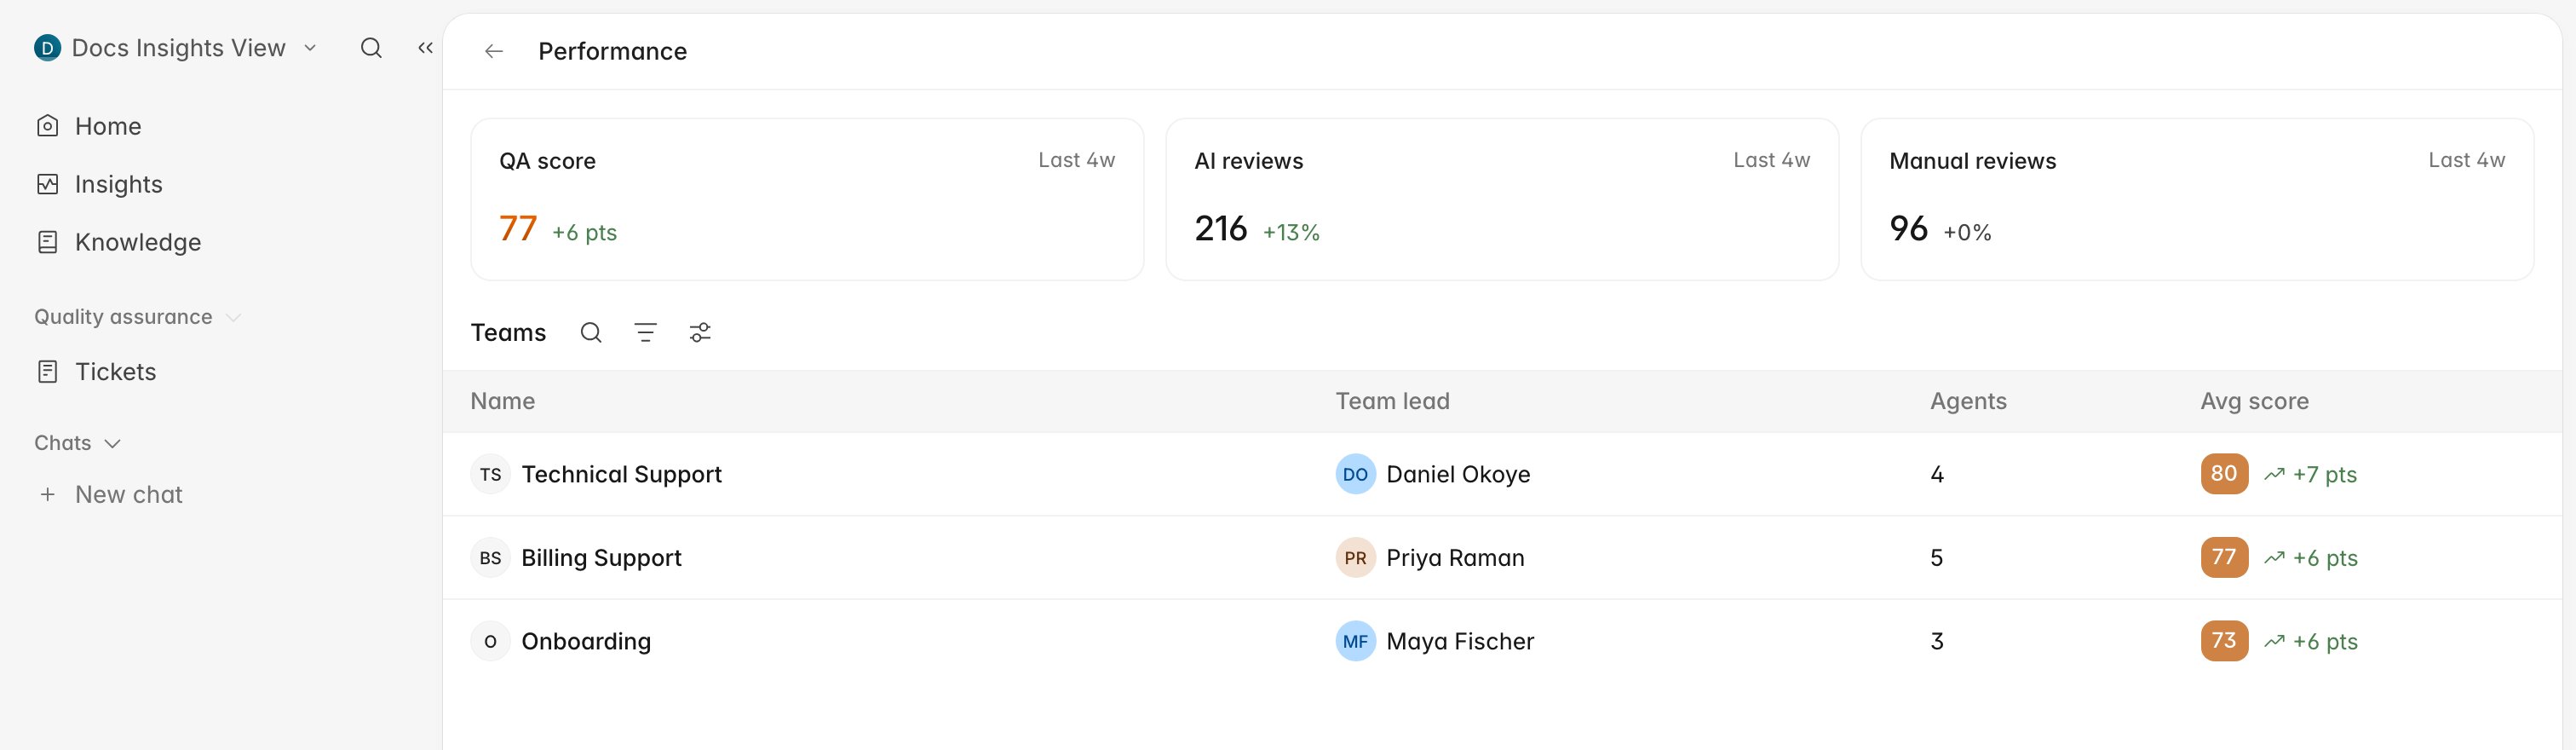
Start with the team list
The list is a fixed four-week view. The cards along the top summarize the whole workspace over that window rather than any one team:- QA score — the average across every evaluation in the last four weeks.
- AI evaluations — how many evaluations AI QA produced.
- Manual evaluations — how many a person entered by hand.
Open a team to see its agents
- Click the team’s row.
- Read the Summary at the top before the numbers. Rulebase writes it from that period’s results, naming what improved, what slipped, and which agent sits lowest.
- Use the date control in the header to move to another week.
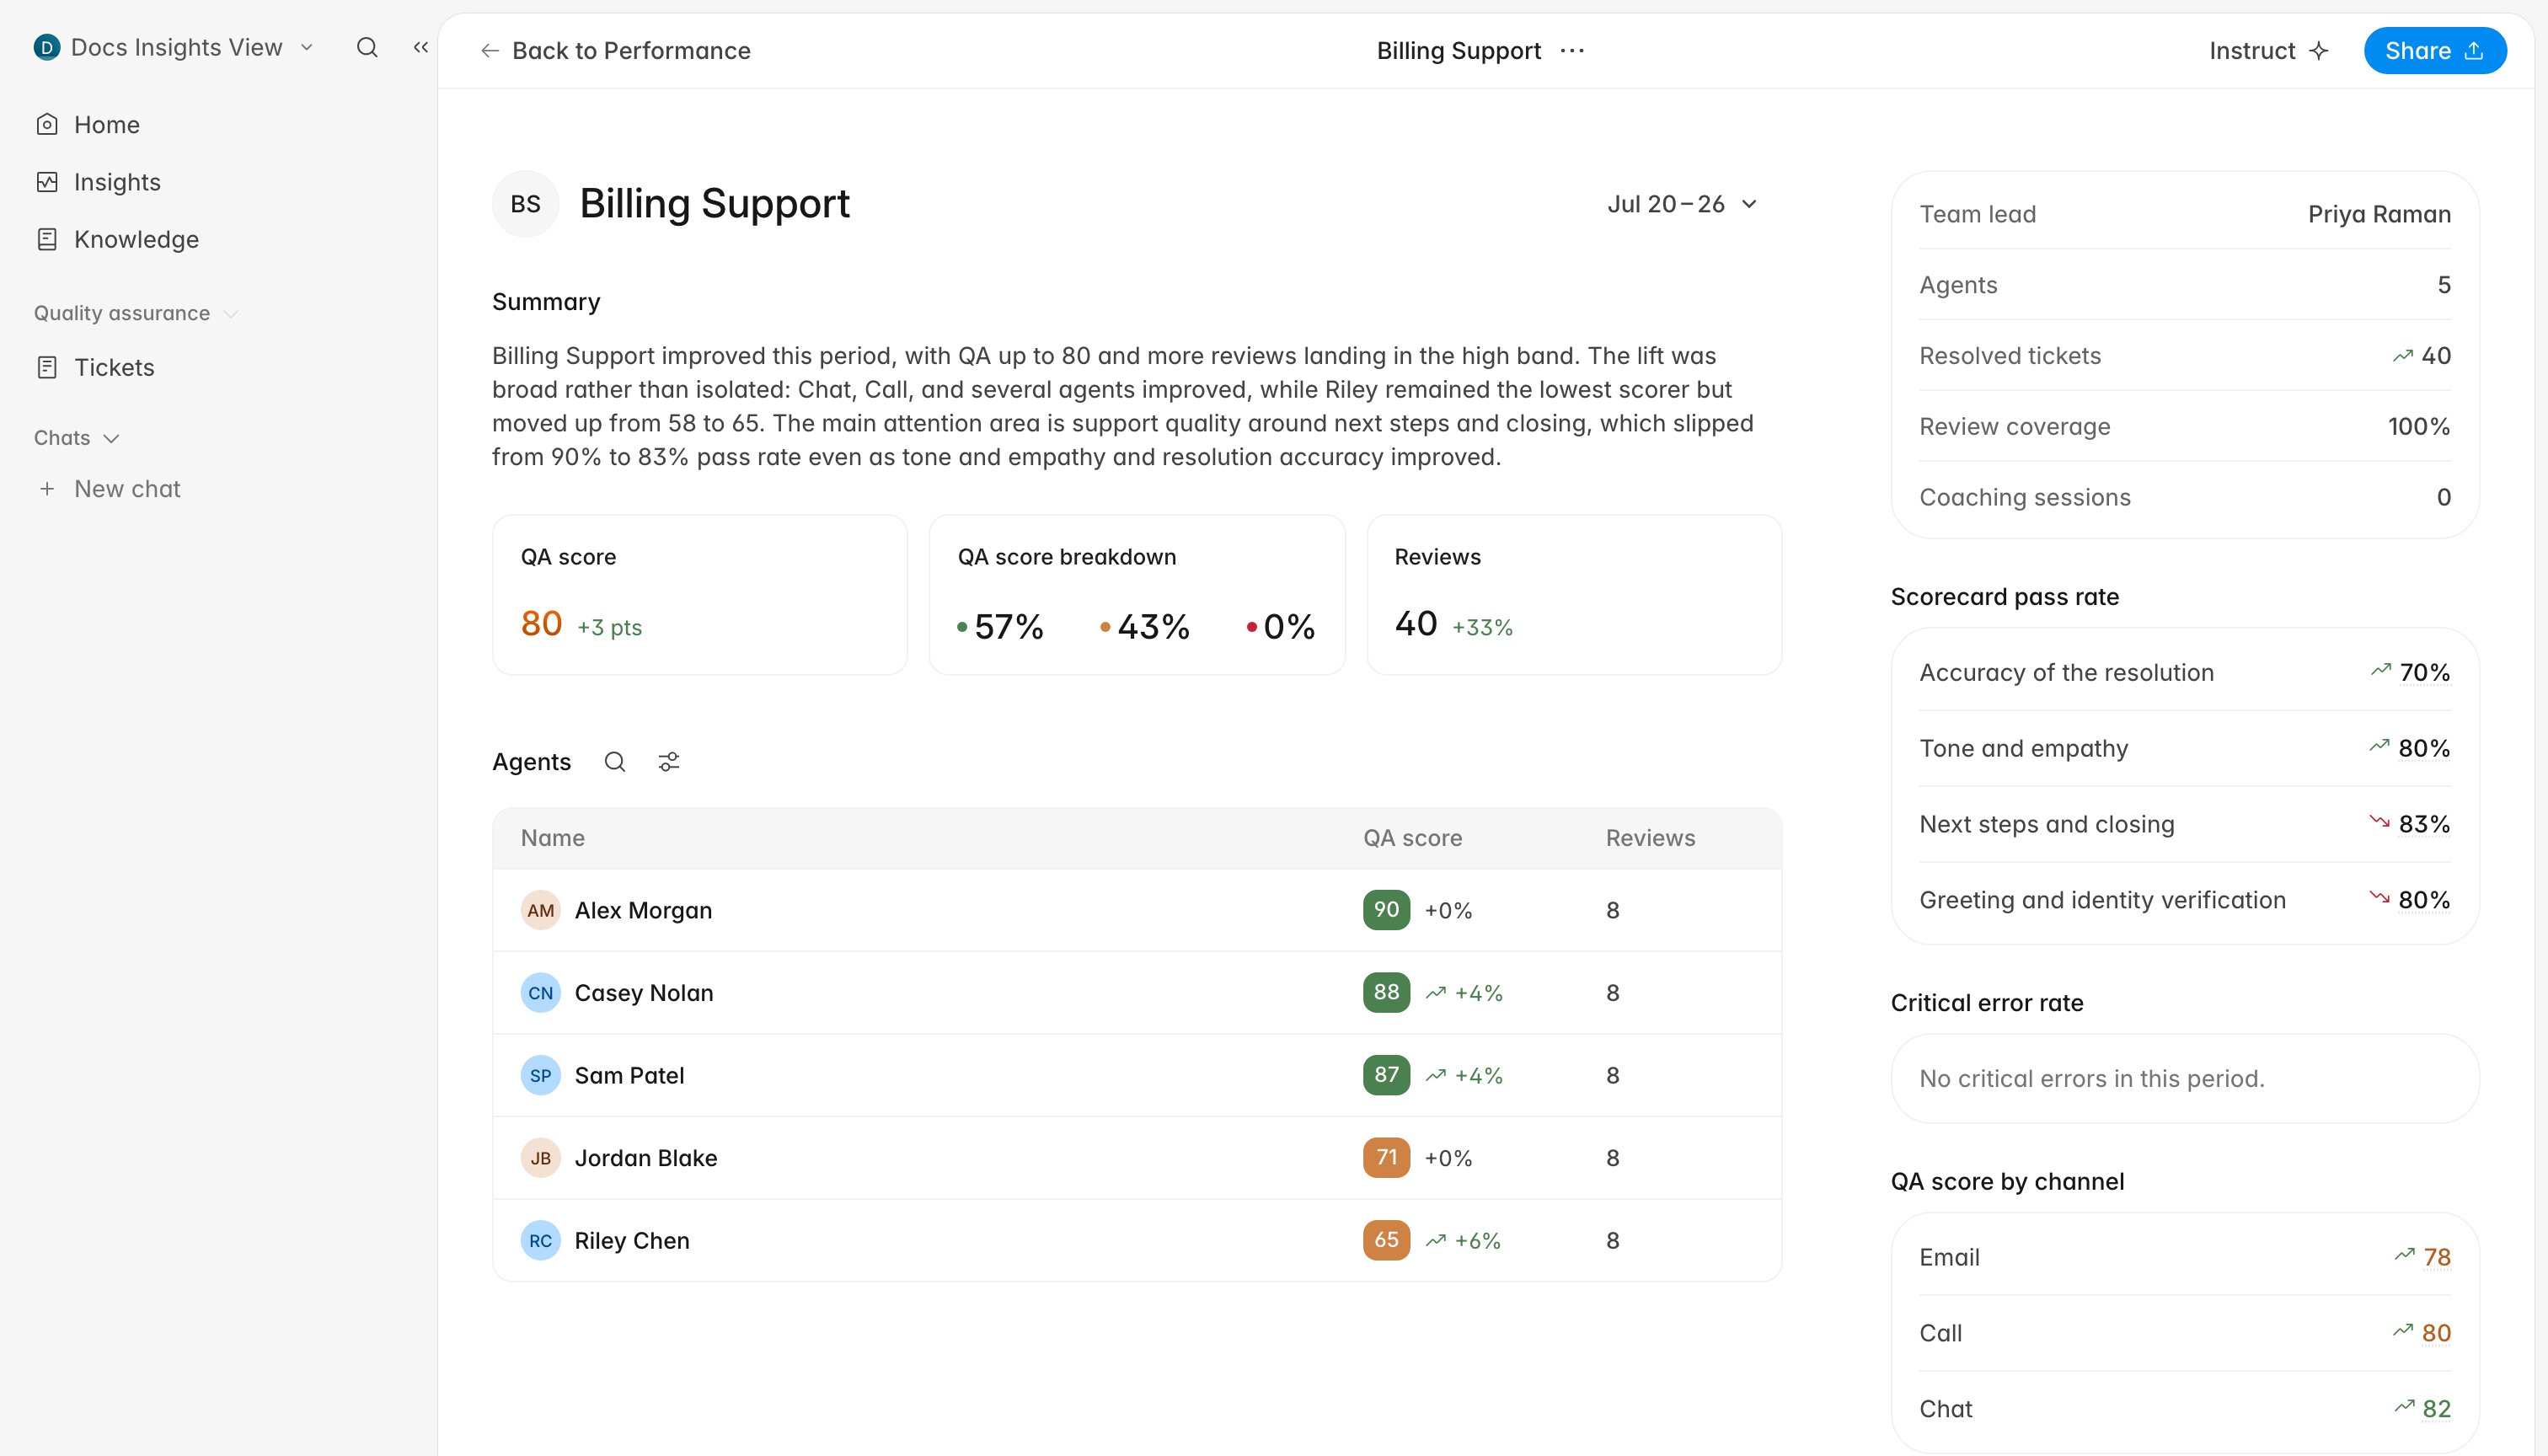
The date control moves in whole weeks. Clicking any day in the calendar selects
that Monday-to-Sunday week, and every comparison on the page is against the week
before it. The four-week window on the team list is separate and cannot be
changed.
Follow one agent into their tickets and evaluations
The Agents table on a team page is sorted by QA score, so the people who need attention are at the bottom of it.- Click an agent’s name.
- Stay on Overview to read their summary and the same headline cards, now scoped to them.
- Switch tabs to get from the summary to the underlying work.
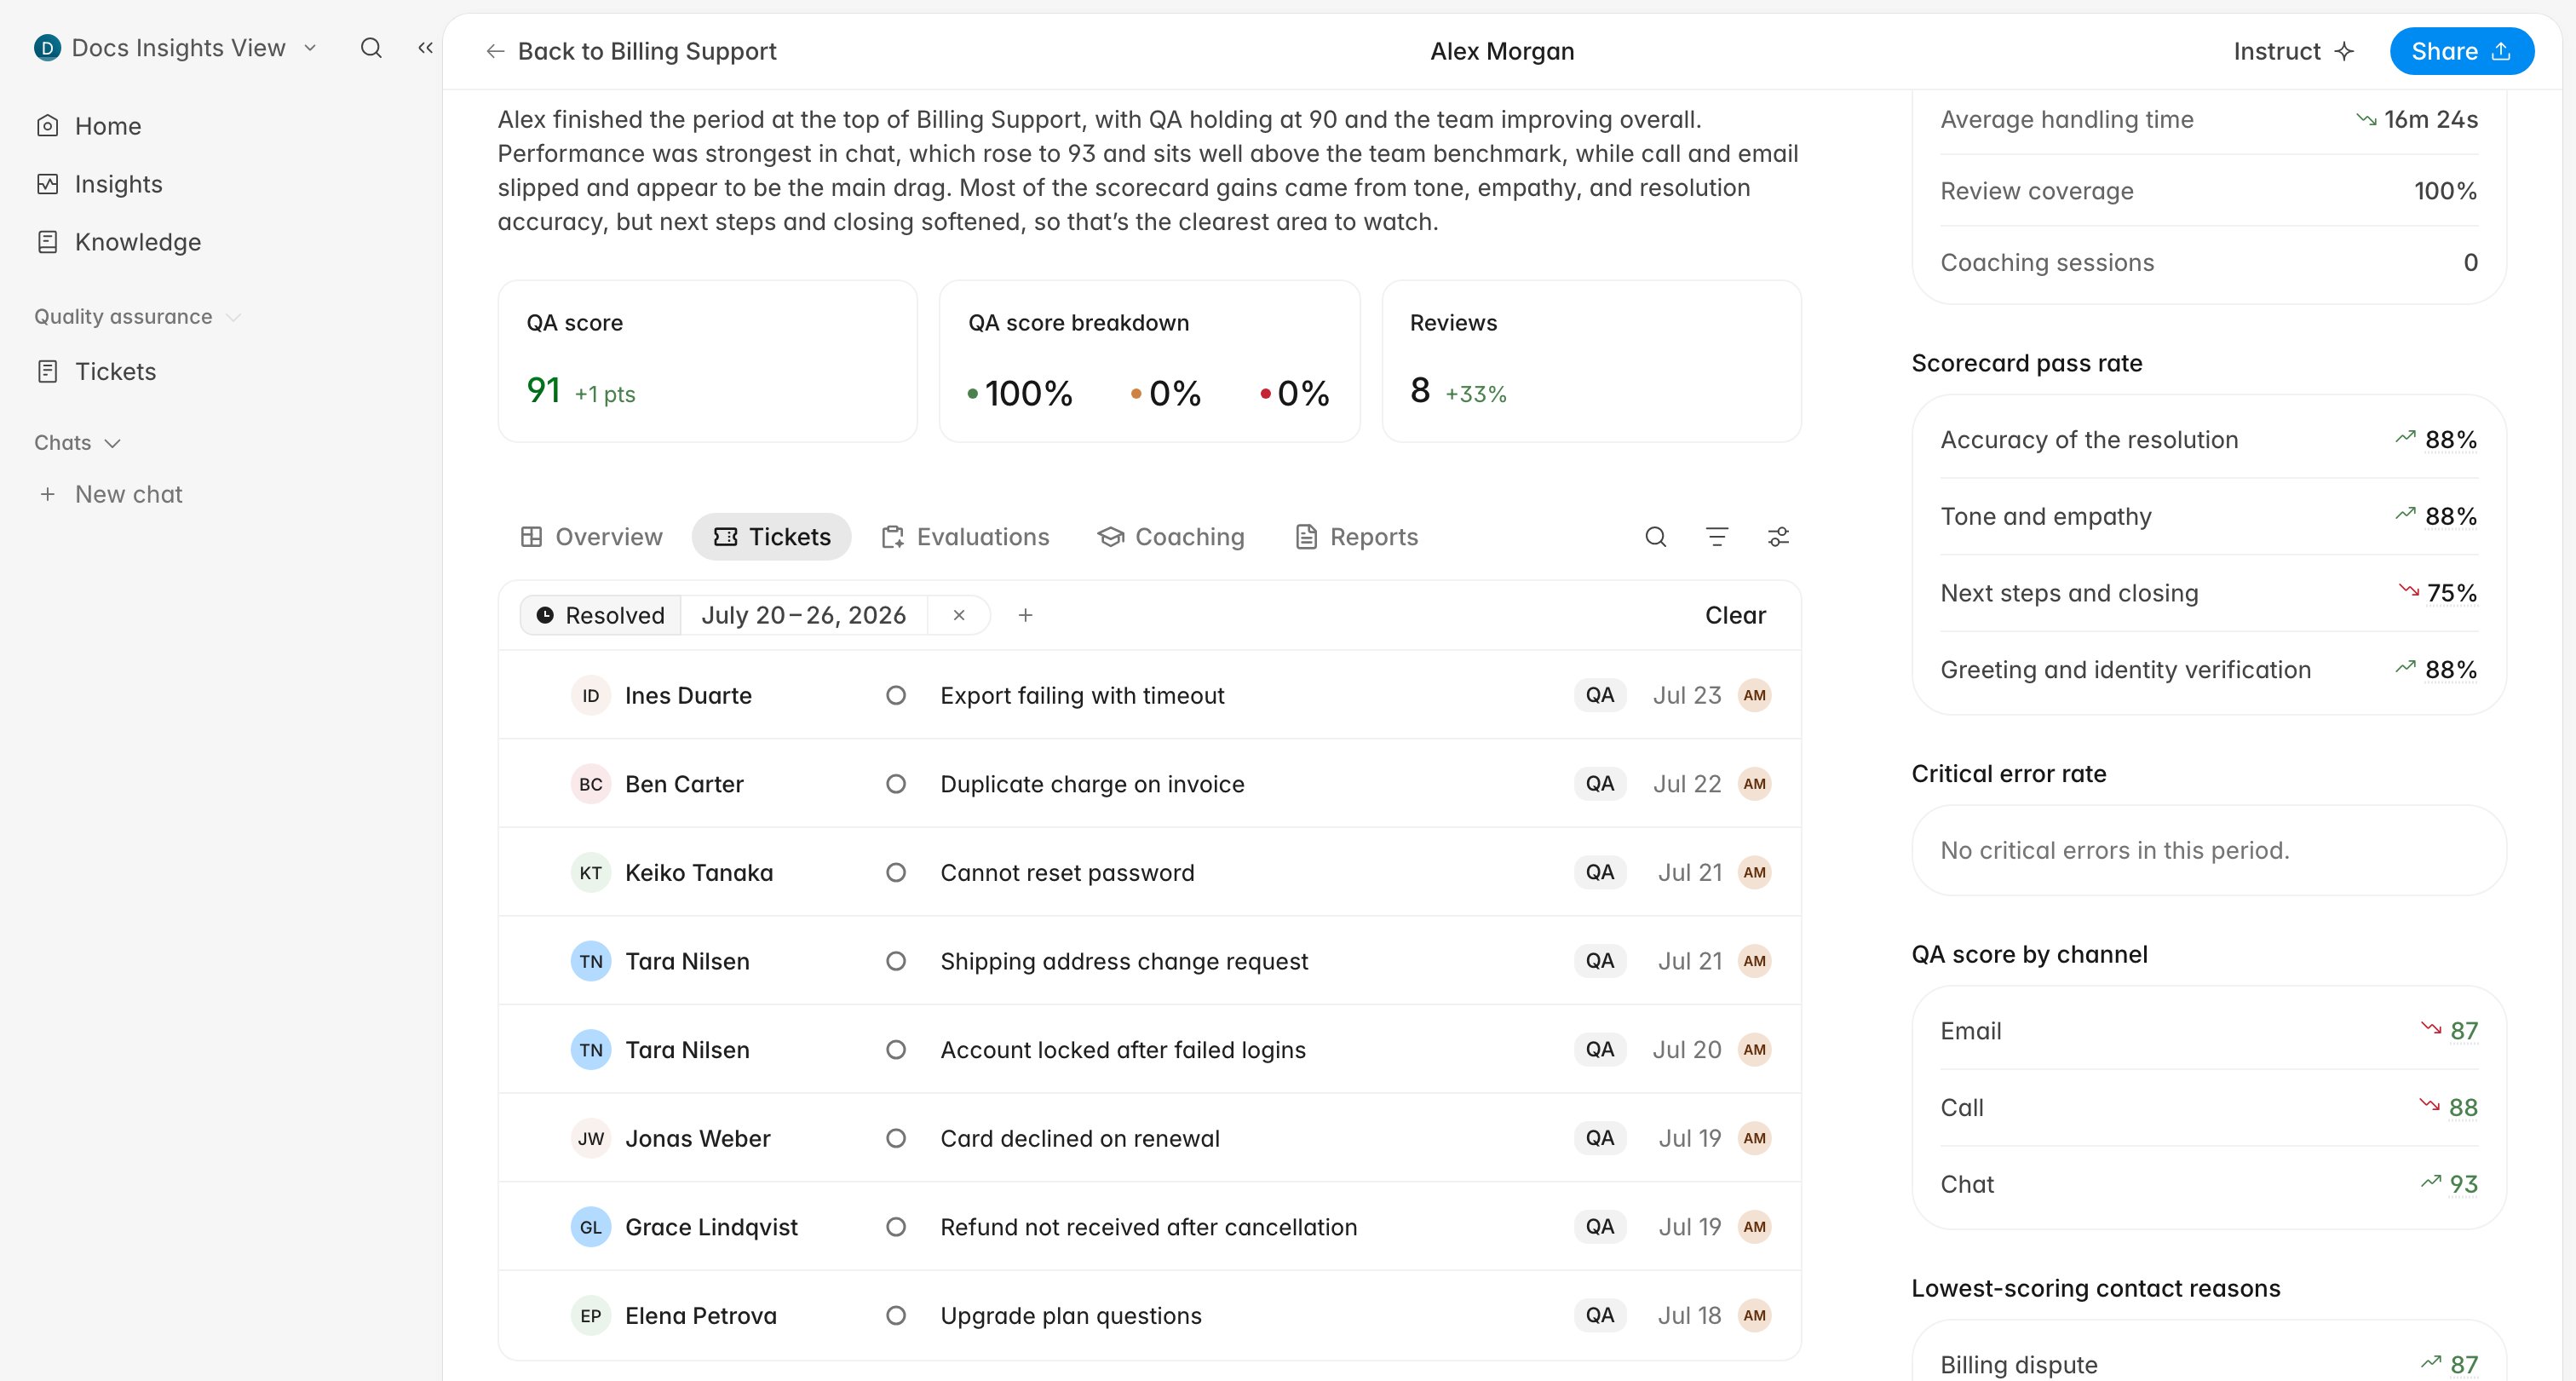
The date control lives on Overview, and moving to Tickets or
Evaluations swaps it for that list’s own search, filter, and display
controls. The period you picked still applies; it just stops being adjustable
from there. Both lists open the ticket or evaluation in place.
The rail on an agent’s page carries a few numbers the team page does not:
Resolved tickets, Average handling time, Evaluation coverage, and
Coaching sessions. Read the score together with Evaluation coverage: 90 across eight
evaluations means less than 90 across eighty.
Turn what you found into coaching
Coaching sessions are created from this page rather than from the Coaching page; the evidence you want to attach is already in front of you. Open Coaching, click New session, and pull in the tickets and evaluations you just read. Run a coaching session covers writing one that the agent can act on, and the sessions you log show up in the Coaching sessions count on this same page.When the numbers look wrong
Before escalating a surprising score, confirm the boring explanations:- The period is a week, not the last seven days. A Monday morning reading is one day of data.
- The agent is on the roster and on the team you expect. Evaluations stay with the team the agent belonged to when they were scored, so somebody who changed team mid-period shows up under both.
- Evaluations exist for the period. Evaluation coverage near zero means the score is built on a handful of tickets.
- Your own membership is not scoped more narrowly than you assumed.