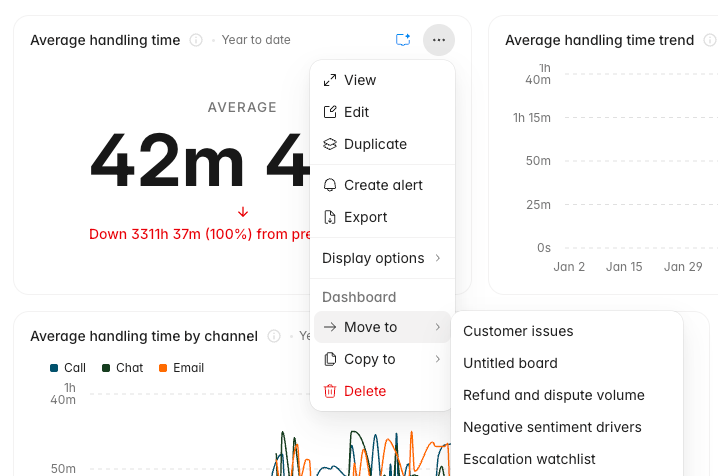
Use a chart’s menu to duplicate it, move it to another custom dashboard, or show it on more than one dashboard. You can also add repeated chart-level filters and export conversation drilldowns. This guide covers the charts. For how boards sit alongside reports, Radar, and the performance pages, see Insights overview.

Duplicate a chart for independent edits

  1. Open the custom dashboard.
  2. Open the chart’s three-dot menu.
  3. Click Duplicate.
Rulebase adds a new chart to the current dashboard with (copy) in its name. The duplicate has its own chart configuration, so you can edit it without changing the original.

Move a chart to another dashboard

  1. Open the chart’s three-dot menu.
  2. Under Dashboard, open Move to.
  3. Select the destination dashboard.
The chart is removed from the current dashboard and added to the destination.

Copy a chart to another dashboard

  1. Open the chart’s three-dot menu.
  2. Under Dashboard, open Copy to.
  3. Select the destination dashboard.
The chart remains on the current dashboard and also appears on the destination. Both dashboard cards reference the same chart configuration. If each dashboard needs an independently editable version, use Duplicate first, then move the duplicate. Custom dashboard chart menu with Duplicate, Move to, and Copy to actions

Add repeated chart filters

  1. Open the chart’s three-dot menu.
  2. Click Edit.
  3. Under Filters, click Add filter.
  4. Choose Brand, Partner, or Agent joined date when available for the chart’s data source.
  5. Set the operator and value.
  6. Repeat Add filter for each additional condition.
  7. Save the chart.
Repeated filters let you express multiple conditions for the same field. The available filter types depend on the chart’s metric and data source.

Export a conversation drilldown

  1. Select a chart segment or value that opens a conversation drilldown.
  2. Apply any drilldown filters or search terms.
  3. Use the display control to choose the visible columns.
  4. Click Export as CSV.
The CSV includes every conversation matching the chart and the current drilldown filters, not only the rows currently loaded on screen. It uses the visible columns and the workspace timezone. Export as CSV produces one file, once. When the same extract is needed every week, or QA data has to land in a warehouse, set it up under Schedule recurring exports instead.